Wednesday, April 1, 2015

Cloud computing has arrived. What will DW/BI do now?

In 1965, the director of research and development (R&D) at Fairchild semiconductor was asked to predict – what is going to happen in the semiconductor industry over the next ten years. Inside the article, the director talked about a huge increase in number of components onto integrated circuits (more than 5 times the current limit). In 1975, the director extended the prediction to future years and IEEE formally created a law that states “The number of transistors (and hence the computing power) doubles every two years”. The director was Gordon Moore and the law was Moore’s law…40 years later, the law is still driving the semiconductor industry and in turn affecting the computing industry and the electronics industry in general. What a revolutionary concept indeed.

Cloud Computing is one other revolutionary idea based on the concept of resource sharing. It refers to having the applications and databases hosted on a system that is shared between many individuals/companies. Contrary to public opinion, this is not a new concept. During the 1970s, when computing power was limited and the resources available to companies was and the resources available were limited, mainframes and servers used to be shared. Then, with the advent of personal computers and systems with higher capacities, companies did not need to share these resources anymore. In today’s world, companies like Amazon and Azure have come up with very inexpensive options to manage the servers and databases of organizations. Companies which were once very reluctant to have their IT systems and databases managed by other companies are not rethinking their stand because of such technological advancements.

The topic in question is the impact of cloud computing and Moore’s law on today’s DW/BI systems. Because of technological advancements, we can now store far more data than what we could 10 years back. Also, computing power has kept pace with the Moore’s law. So we can compute more, analyze more and come up with better insights. But the important thing here is ‘Are the BI tools capable of taking advantage of this increased power?’ The answer is, they are. The tools in existence today have the capability to analyze gigabytes and terabytes of data. The tools that cannot do that will likely be extinct in near future. It is considered a critical disadvantage if the tool cannot handle large volumes of data. A little caveat here, there have been some serious discussions in the industry as to the future applicability of moore’s law. The technologists feel that the industry might be going towards saturation. The number of transistors and in-turn the computing power may not increase at the same pace as it was growing before.

This brings us to the next question… Now that we have such cloud computing options available, what impact does it have on the data warehouses and Business Intelligence tools? One thing is for sure, cloud computing does provide some very useful solutions. Wouldn’t you love it if u can spend less and have your IT systems managed well at the same time?

Let us think about the future of data warehouse and if it is affected by cloud computing or moore’s law.

Go as you grow:

One of the biggest concerns of any organization is how to handle the new data that they just created. It affects the technology infrastructure of the company and in-turn affects the business. It is expected that the future enterprises will want the analysis of data on the fly. They would want to store more data without planning for it in advance. This brings us to cloud computing. No need to architect, build, maintain or upgrade your data-warehouse. It will be done for you. Of-course the privacy and security concerns are inhibitors. Companies and individuals want to protect their data. For that, we have private clouds and hybrid clouds. We are slowly seeing more and more companies going for cloud based services because of the flexibility it provides.
Also, it is expected that companies might want to just logon to a website or a portal and check the dashboard. They would be fine with the analysis being done some-place else and them getting the results wherever they are. This is a direct outcome of cloud computing.     

Cloud Based BI
Despite such advances in data storage and retrieval technologies, cloud based BI is still in its nascent stage. However, it shows a lot of potential. In 2014, Birst and Gooddata gained more VC funding in 2013. Microstrategy plans to enter the cloud market for BI, Microsoft Power BI is also planning to unveil cloud based solutions. BI scalability is going to be of paramount importance to organizations.

Below are some of the reasons for using Cloud BI

CLoud Figure 2.jpg


Talking about their future goals, the companies said
Cloud Figure 3.jpg

In Short…
I feel that data storage will get cheaper, cloud technologies will become more prominent and companies will benefit more from them. There will be hurdles with giving up control of your systems to a third-party and will hinder companies from moving on completely to cloud. But there will be a very good number of companies that will benefit from such advancements in technology – be it for DW/BI or for anything else.


Wednesday, March 4, 2015

Presentation and Visualization Methods for different industries

Presentation and Visualization Methods for different industries

After studying the basics of dimensional modeling and exploring various Business Intelligence tools, I felt the need to explore the differences in visualization methods for various industries. In this blog post, I will be talking about the different techniques and methods for presenting data in 3 different industries – retail, healthcare and e-commerce. All these industries are very different and have different KPI (Key performance indicators) to focus on. This leads to different data

Retail
For the retail industry, the main drivers of the business are product sales, customer relationship and inventory management. The analysts working on retail sector usually focus on these 3 segments of the business to know how well the company or the industry (as a whole) is doing.
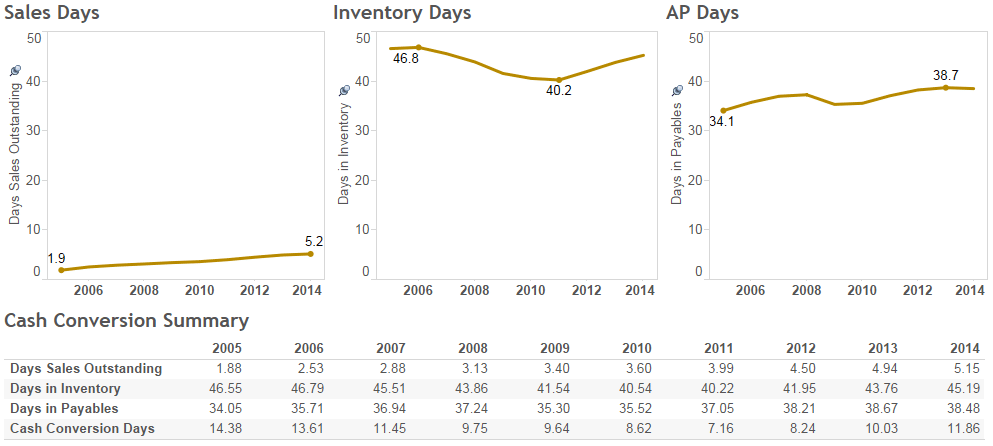
Below is an example of a dashboard for a retail company


The 3 parameters measured here are sales days, inventory days and Accounts Payable days. Here, the parameters are compared for the same company over the last 8 years. From the graphs, we can see that the values for these 3 parameters hasn’t changed much over the years. Although there were temporary ups and downs, the overall values have little changes. If this were the graph for the whole industry, we might be able to deduce that operationally, the industry is very stable and there are no major factors affecting the industry. Here, we have compared the parameters over the years. We can also compare the parameters of one firm against that of another firm within the same industry. In that way, we would be able to say if a firm is competitive within the industry or not. It is a totally different outcome altogether.
Here, we have a line chart to visualize the movement of these critical factors over the years. If it were comparison between 2 companies for the same parameters, we could have used the bar chart or use the line chart. When we use the line chart, we just want to see the pattern. But when we use the bar chart, we want to look at how 1 firm stacks up against another.

Healthcare
For the healthcare segment, the primary KPI to focus on are clinical, operational and financial metrics. Today, the healthcare costs are spiraling in US. Hence it is very important to keep checking these parameters regularly.

One of the possible dashboards for a healthcare firm would look like

Healthcare Metrics Dashboard

If you compare the graphs for the healthcare with the graphs of retail, we find that even-though the parameters are compared over the years, they have been represented in different ways for both industries. Here, similar data is shown as bar chart and volume graph. Through these graphs, the hospitals can analyze values for a particular year as compared to its peers. Here, the focus is not too much on trend as is on comparing it with neighbors. Also, if we look at the graphs of monthly mortality rate or nursing workload analytics, we find that the focus is on percentage of total. There is an upper limit here that should not be crossed. The more closer a hospital/clinic is to the upper limits, the more dangerous it is to manage them – financially as well as operationally.

Electronic Commerce
Since the inception of Amazon, the world of retail has changed for good. The retail metrics are no longer restricted to pure store sales. Concepts like multi-channel sales, online advertising, google analytics etc. which were never thought of as important before have suddenly become main-stream now.


The figure here is an example of goggle Analytics dashboard. Here, the data is being compared to other substitutes for the same parameter. Because we know all the possible substitutes in the universe, we are using a pie chart to represent the percentage sales for a particular device (for example: iPad vs iPhone) or percentage sales per channel. For specific numbers important for the analysts/management, the data is directly represented in a table.


In general, any information can be represented in a table format. But the visualization will be decided based on purpose of the metric and how you intend to measure the KPI.

References:


Thursday, February 19, 2015

Data Warehouse in the times of Unstructured Data

We as humans find it easy to understand something when it is represented in a logical manner. On the other hand, computers and other machines need data to be organized in a structured manner to understand it. Structured relational data is the data represented in a structured way according to some specific rules that make it easy to understand, analyze and interpret. On the other hand, unstructured data refers to information without a predefined structure (obvious… isn’t it?). Computers don’t care if the data is logical or not. All they need is for the data to be organized in a particular manner. On the other hand, we humans can understand unorganized data like text, images, videos etc. Now-a-days, there are technologies with the capability to work on unstructured data. This has opened up new avenues for mankind as data previously considered unusable for computers can now be used. We can gleam new insights from it.

For structured data, languages like SQL are used to retrieve data. As we can guess, SQL presumes that the data is arranged in a structured manner. The statements used to retrieve data from database using SQL have a specific format (known as syntax). Although there are other languages/tools that are used to retrieve data from structured relational tables using common language phrases/sentences like fetch me X, Y and Z from table t1 where condition c1 happens, they internally rely on the data being structured.  

Talking about space requirements, structured relational data requires very little space as compared to unstructured data as structured data is designed to be used by machines. But, there have been 2 major changes in technology today that tilt the balance in favor of unstructured data: technologies to analyze unstructured data AND cheap storage. Owing to organization within a structure, structured data is easy to work with – for manual queries as well as automated queries (like search engines). But trying to understand unstructured data requires more than just a few queries. It requires one of the new functions of Web 3.0 – NLP (Natural language processing) which is a whole new game altogether. Examples of structure data include tables and spreadsheets. Examples of unstructured data are sensory data, call records data, images etc.

For most of the organizations, technology plays a supporting role. It is useful only if it can help the business gain strategic advantage over their peers. The technology to manage/analyze unstructured data came into place just a few years back. That is why, we now see organizations starting to adopt such technologies. Just looking at the volume of different types of data with organizations today:

Here, block based capacity refers to Structured data and file-based capacity refers to unstructured data


Technically speaking, a data warehouse is a system used for reporting and data analysis. They are centralized collection of integrated sources from variety of disparate sources. Traditionally, data warehouses were designed to work only with structured data. The sources of data as well as the methods used to work on them were based on the assumption that the data is structured. But now, the situation is different. Approximately 80% of business data is unstructured. And as expected, most of this 80% does not reside in a standard relational database. Businesses want to be able to rapidly analyze unstructured and structured data. Trying to store huge volume of unstructured data inside the traditional warehouse is a very tedious and time-consuming job.


If organizations want to deal with unstructured data, they either need to redesign their database from scratch, or they need to upgrade the existing databases and tools. They may have to start using/customizing big data tools and technologies like Hadoop and MapReduce. Although it is the matter of technology upgrade, the decision affects the organizations in critical ways. Hence, the decision has to involve business teams as well as technology teams. They have to incorporate integration techniques for all the processes from ETL to advanced analytics. They need to add metadata details for the unstructured data and that, is a very tedious process. Also care needs to be taken to avoid creating a data junkyard. New processes and systems for managing the documents has to be put in place. Techniques like the backward pointers might have to be used. Below is an example of how text analysis might be used


As fancy as it may sound, a data warehouse is not an elixir that could solve all the problems. There are some issues with analyzing data from a data warehouse      
  • Structured data is easy to manage in terms of ownership, security and privacy. But it is difficult to do so for unstructured data.
  • Storage and reteival of unstructured data from a warehouse is very difficult and time consuming
  • The amount of storage required for unstructured data is far more than what is required for structured data. An indirect implication of this is more time required to clean, filter and transform the unstructured data

Talking about the future of data warehouse, I feel that the traditional data warehouse will be highly integrated with the unstructured data warehouse. The primary purpose of the data warehouse will be to handle unstructured data. There will be more complex tools to work on unstructured data and they would also be integrated with the data warehouse. One major drawback of data warehouses today is the lack of real time analytics. This might not be true in future. With the advent of real-time data processing softwares, it seems plausible that the data warehouses in future would provide real time functionalities. Also, it is safe to assume that the data warehouse might be stored on clouds instead of traditional storage houses. Optimized warehouse is another thing that we can expect in future. Current warehouses are designed to work on static data. With unstructured data being stored in the database and the possibility of real-time analytics, we can expect future data warehouses to be highly optimized - for storage as well as for speed.

Overall, I feel that the data warehouse industry is poised to grow a lot and will go through a lot of changes in future. It will be a future that we all would like…


References:

Tuesday, February 3, 2015

What makes a good Business Intelligence Tool?

Talking about the current state of technology today, the term “Business Intelligence” has become a popular buzzword. Just look at the amount of data generated by companies today. Today we don’t talk about megabytes or even gigabytes of data. You will see hard-disks that can house terabytes of data in the hands of almost anyone who has a portable hard-drive. Yes, I am talking about people, people like you and me. Just think of the times of the year 2000, we could only think about such storage capacities only for firms. What changed in last 10-15 years? The main reason is that the hard-disks got cheaper and the disk makers were able to pack in more gigabytes of storage in a smaller box at low cost. What does this imply for companies who used to store much more than what retail consumers do today?

“Higher Complexity in data analysis and huge amount data to simplify”

Hail the return of Business Intelligence (BI)...

According to Wikipedia,

“Business Intelligence (BI) is the set of techniques and tools for the transformation of raw data into meaningful and useful information for business analysis purposes”

The BI tools and technologies have the ability to work on huge amounts of data and analyze the data to give meaningful insights, insights that could be used to achieve strategic business goals. BI tools have also been known to provide competitive advantage. For example, if you are a retail company and based on the purchase information of products, you could identify which products sell the most and when do customers flock to buy a certain product. If you are the only one doing it, you get the benefits of low inventory, better managed products and huge cost benefits. Interesting, don’t you think?

In this post, I am going to analyze 5 well-known BI tools based on 5 criteria and then come to a conclusion as to which tool is the best based on the chosen criteria.

First, let me talk about the criteria.

Criteria:
·        
      Reporting  This feature refers to the capability of the tool to create static and interactive reports representing summarized data in the data warehouse. Interactive reports allow users to dynamically create new reports based on user-input. This is the most important capability that is expected out of any BI tool. Apart from being interactive, reports are expected to have drill down and group outcome for a given data-set.

·         Ad-hoc queries
This feature allows users to create their own queries and create their own reports by using their ad-hoc queries. The key to this capability is having an added layer that hides the complexity of underlying data sources and allowing the user to create new queries in simple language terms instead of a query language like SQL. Because Ad-hoc queries are created and used by users on-the-fly, there might be performance issues while executing the query. Hence dynamic query optimization
  
·         Interactive Visualization
This feature allows data to be displayed in visual format using pictures and charts). It is a very well-known fact that a picture represents far more information than words. Also, users usually prefer pictures and charts in the output rather than facts represented in tabular format. Previously, BI tools had graphical ways to show output. But, today’s BI tools are capable of creating graphical output on the fly, including the output for dynamic queries or the cases where the user wishes to drill down or summarize the output of an existing report.

·         Cost
It refers to how much would it cost to purchase the BI tool. For certain tools, individual features might have their own costs. We need to consider the costs (the tool cost + cost of extra features) when deciding on the tool. Although a user usually wants to have all the features of a product/tool, it might not be always feasible for the organization to buy a full-fledged version. Also, we need to consider the costs of licensing and training/retraining users for the tool. There is always a trade-off between cost and the value derived from the tool.

·         Ease of Use
The people who create the tool and the people who end-up using the tool are very different from each other. Their technical capabilities are very different. Any BI tool should be made from the point of view of the end-user. The end-user is not expected to have the expertise of the tool developers and expect the tool to be fairly simple to learn and use.

Now that we have an idea of the parameters used to evaluate the tools, let us start talking about the tools:

Tools

Oracle BI

Oracle has multiple tools in the BI space. Companies can buy the tool that would best suit their needs. For large enterprises, oracle provides ‘Oracle Business Intelligence Foundation Suite’ and for small/medium enterprises, oracle provides ‘Oracle BI Suite Standard Edition One‘. For our discussion, we will be considering Oracle Business Intelligence Foundation Suite. It includes capabilities like Enterprise BI, mobile BI, OLAP analytics, Enterprise Reporting and Scorecard & Strategy Management

Pros
  • Integrated dashboards
  • Strong administrative capabilities

Cons:
  • Unintuitive tasks and interface (not user friendly)
  • Lags pure-play vendors on innovation front (like mobile BI)

Cost: The cost varies based on how many features do you need, the number of end-users and the kind of support you require from Oracle. The base price is about $300,000 (without additional features and additional users).

Microstrategy

Microstrategy is a company dedicated to providing Business Intelligence and mobile solutions. It is primarily into enterprise BI market. Their tools (like Microstrategy analytics) use data from variety of sources (data warehouse is just one of them) to create reports as well as provide analysis on the data.
Pros:
  • The benchmark in large BI deployments for enterprises
  • They offer the most required features to customers

Cons:
          ·      Not easy to use
          ·      Not easily integrated with other databases and systems
Cost:
Costs about $600,000 per CPU core in the server
Costs about $300,000 per CPU core for web-based use

Tableau

Tableau is a company that focusses on products purely on data visualization in business intelligence.

Pros:
          ·         Interactive & leading edge data discovery
          ·         Top notch visualization capabilities
          ·         Easy to use
          ·         Easy to import data from different sources

Cons:
          ·         Lacks standard capabilities like production reporting and metadata management
          ·         Not considered industry standard
          ·         Not easily scalable when the dataset size increases

Cost:
Desktop License: $999 - $1999 (depending on personal/professional license)
Online: $500 per year

SAP Business Objects

SAP Business Objects is the part of SAP that offers BI tools to enterprise users. It is a suite of front-end applications that allow users to make use of the BI capabilities like view, sort and analyze data (reports, dashboards, Explorer).

Pros:
          ·         Easily integrates with SAP
          ·         Data stored in flexible structure. So easy to scale
          ·         Easy to deploy
          ·         Data retrieval and maintenance is fast and simple

Cons:
          ·         Integration is tough as there are multiple applications for specific purpose
          ·         Different environments required by specific applications, making it tedious

Cost:
There are separate products for individual components. So cost varies based on the components bought

SAS

SAS (Statistical Analysis System) is a software suite that provides functionalities of business intelligence, data management and predictive analytics. It is the market leader in the advanced analytics space.  

Pros:
         ·         SAS can handle any data set or data type. SAS excels at data management
         ·         Industry and domain specific analytics applications
         ·         Industry standard for statistical analysis

Cons:
         ·         It takes time to get used to SAS features. Difficult for business users
         ·         Special skills needed to change algorithms for SAS
         ·         High cost

Cost:
Single user license could go over $100,000 per year


Tools
Oracle BI
Microstrategy
Tableau
SAP BO
SAS
Criteria
Weight


Reporting
25%
7
8
9
8
7
Ad-hoc Queries
20%
7
7
8
8
9
Interactive Visualization
10%
6
8
10
7
5
Cost
30%
6
6
7
5
2
Ease of Use
25%
4
3
10
7
4
Points
100%
6.55
6.75
9.45
7.55
5.65
Rank

4
3
1
2
5

So overall, on the basis of the criteria considered for analysis and the weightage given to them, I would recommend to use Tableau as the BI tool.

References: